Data Analysis Portfolio
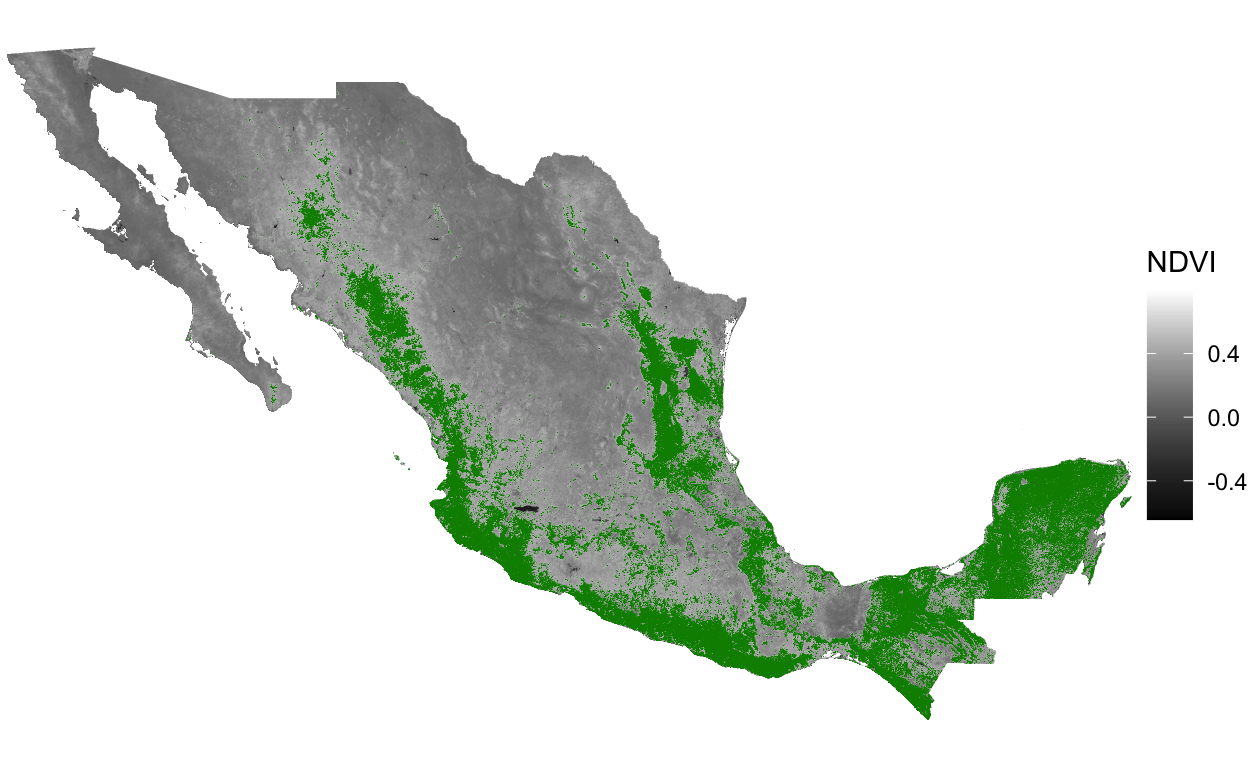
Normalized Differential Vegetation Index in Mexico - Remote Sensing Analysis
This project shows the analysis of Landsat 8 satellite images of Mexico to calculate the NDVI. It includes preliminary raster manipulation from raster files I created using Google Earth Enginle.
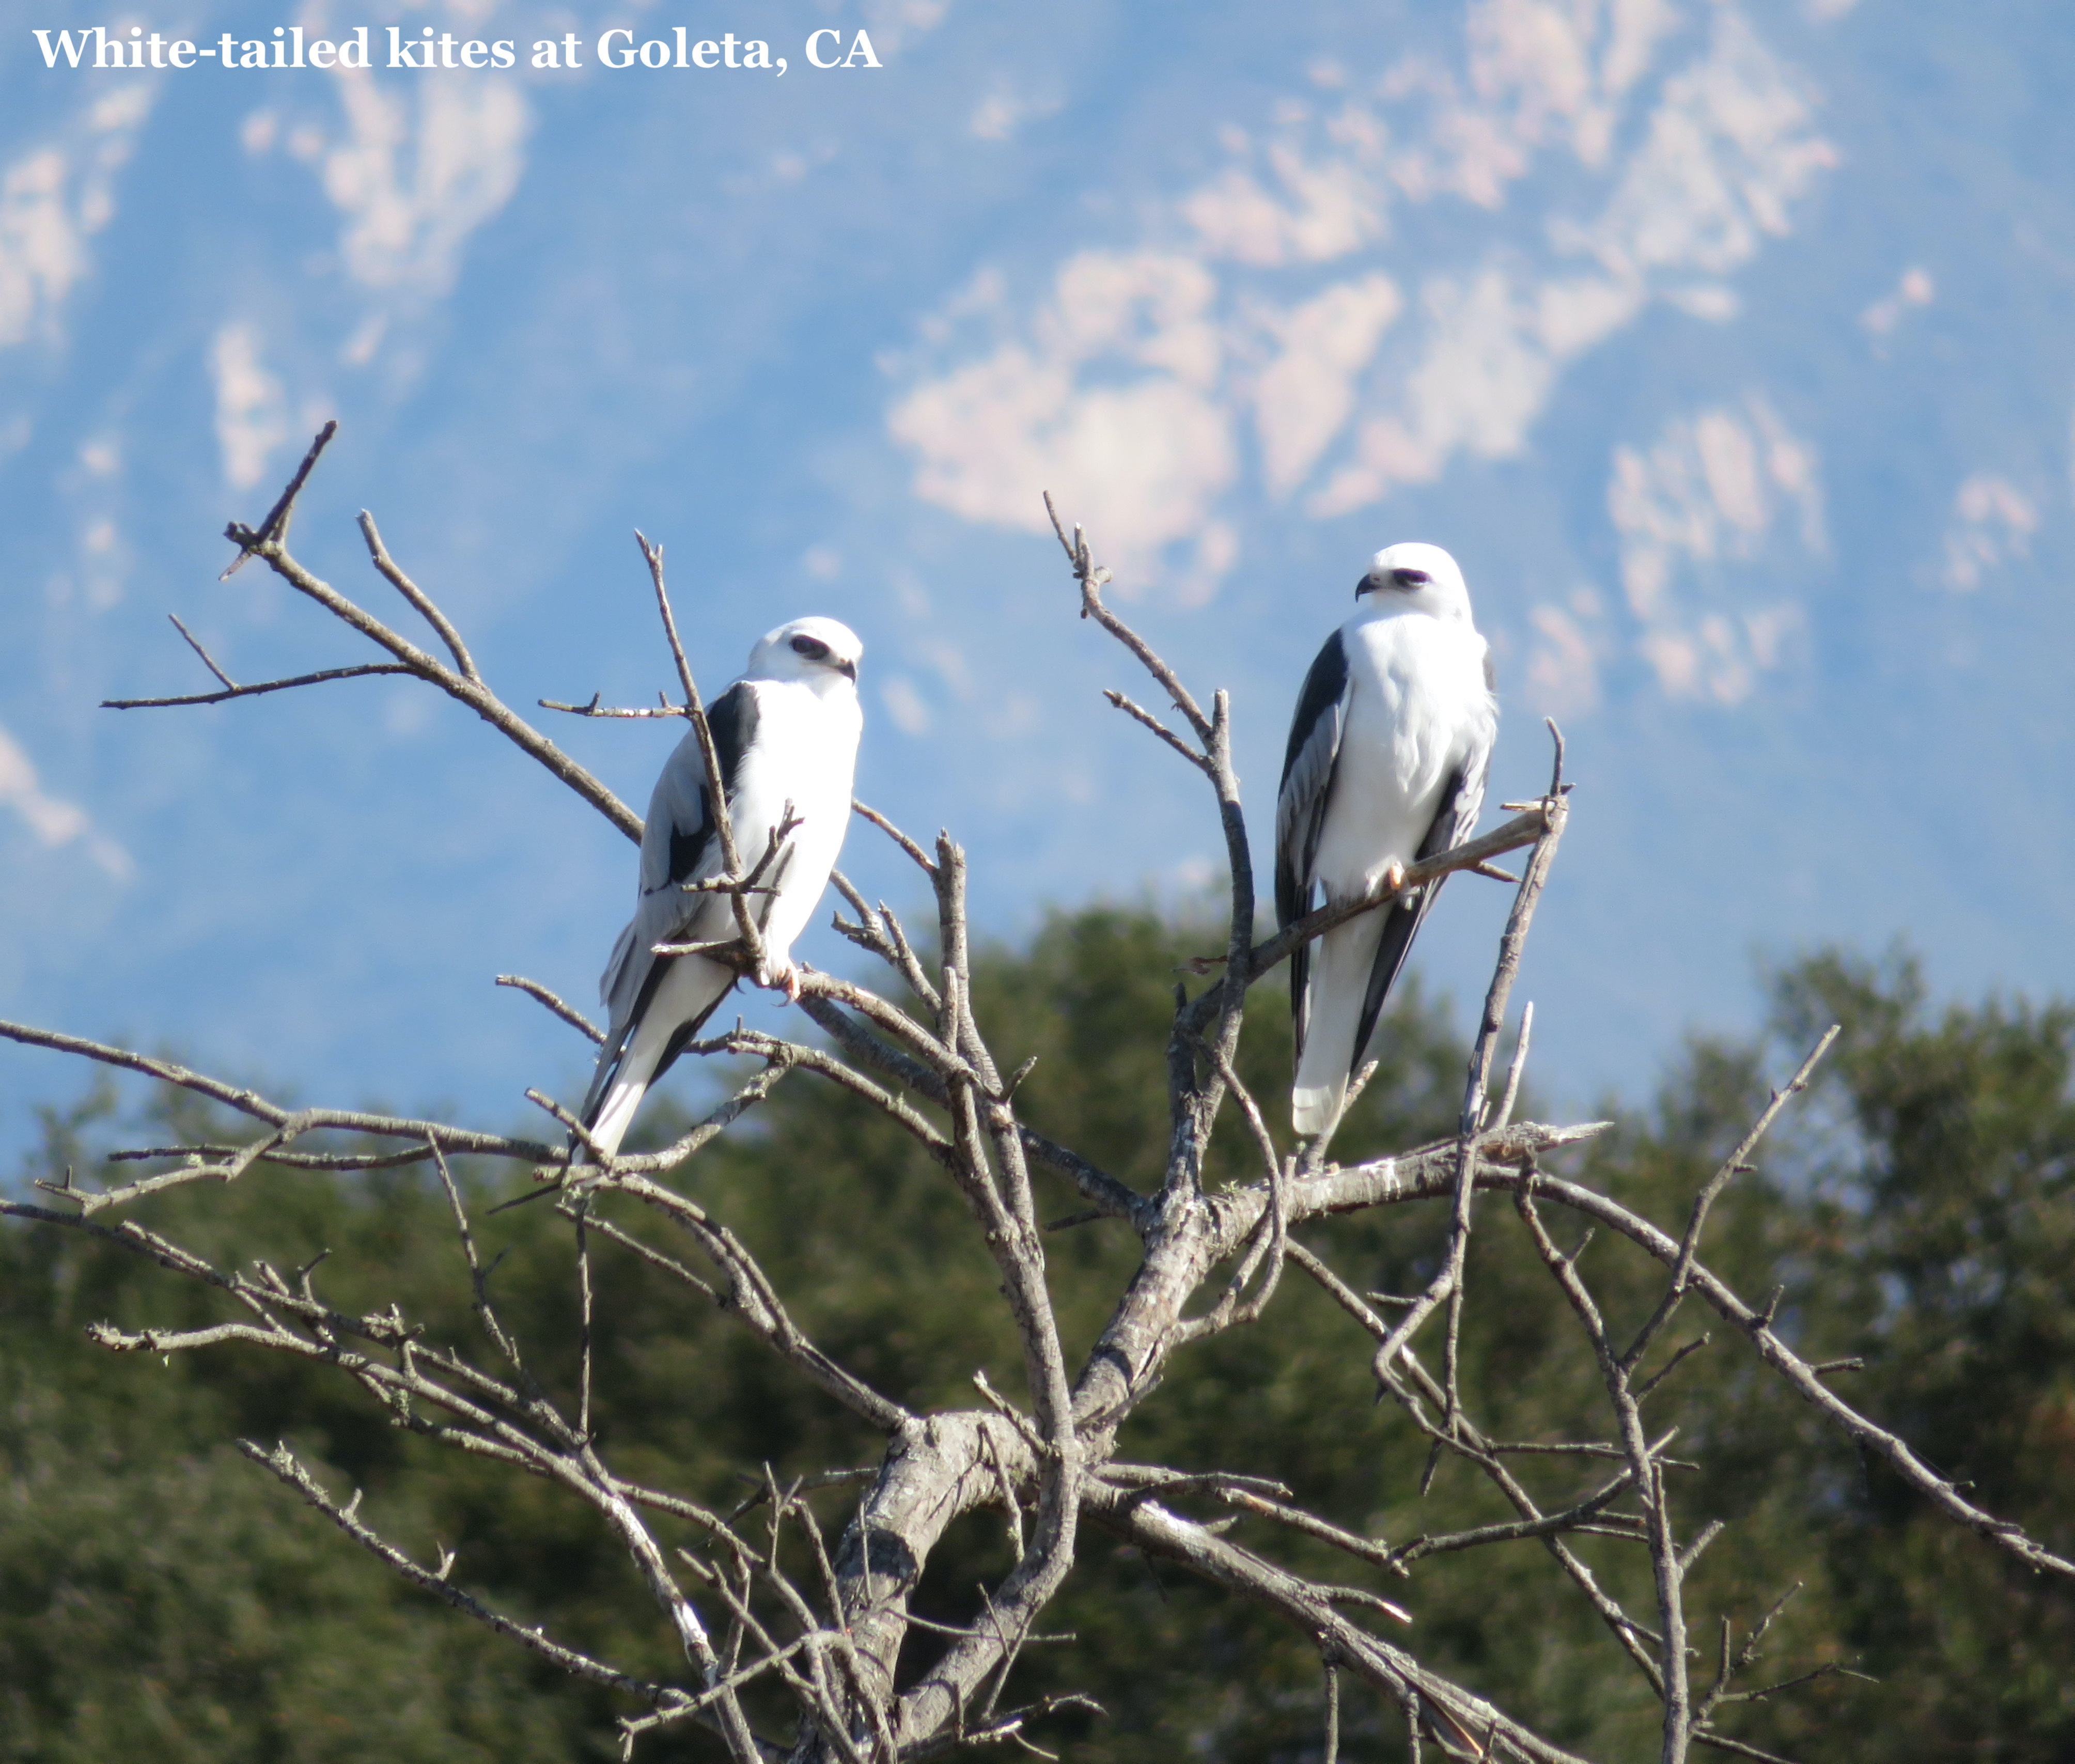
Birds of North Campus Open Space - R Shiny app
RShiny web app that explores 50k+ bird sightings at North Campus Open Space from the eBird database and the Santa Barbara County Breeding Bird Study.
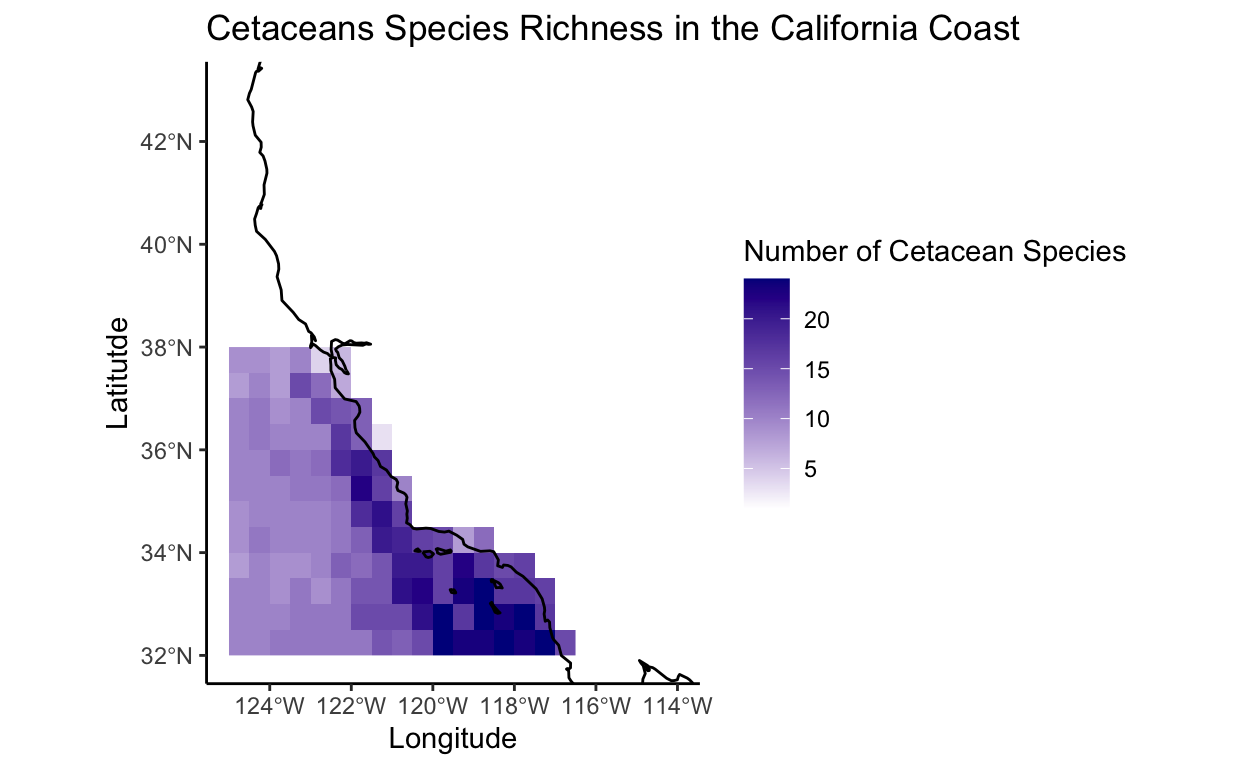
Raster map: cetacean species richness in California
A raster map created using the probability of occurrence of 35 cetacean species found in the California Bight.
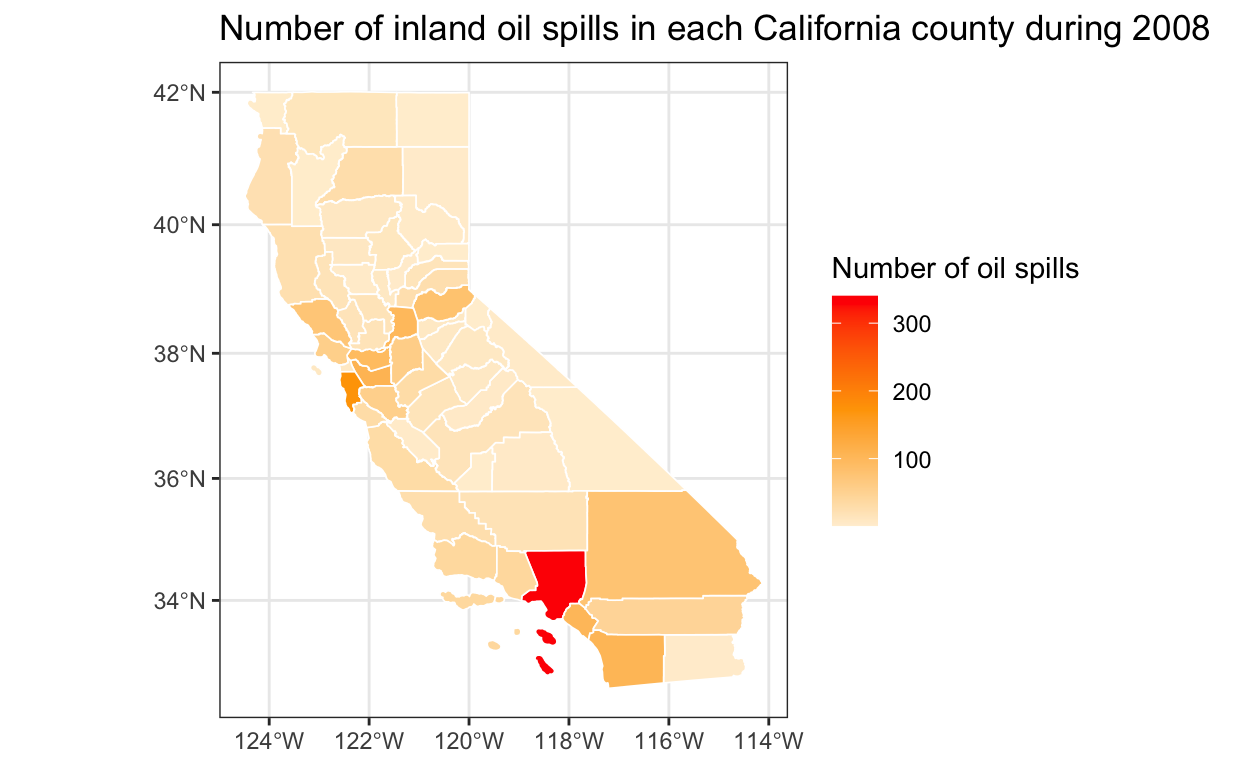
Maps (GIS): visualizing oil spills in California
Choropleth and interactive maps exploring California oil spills.
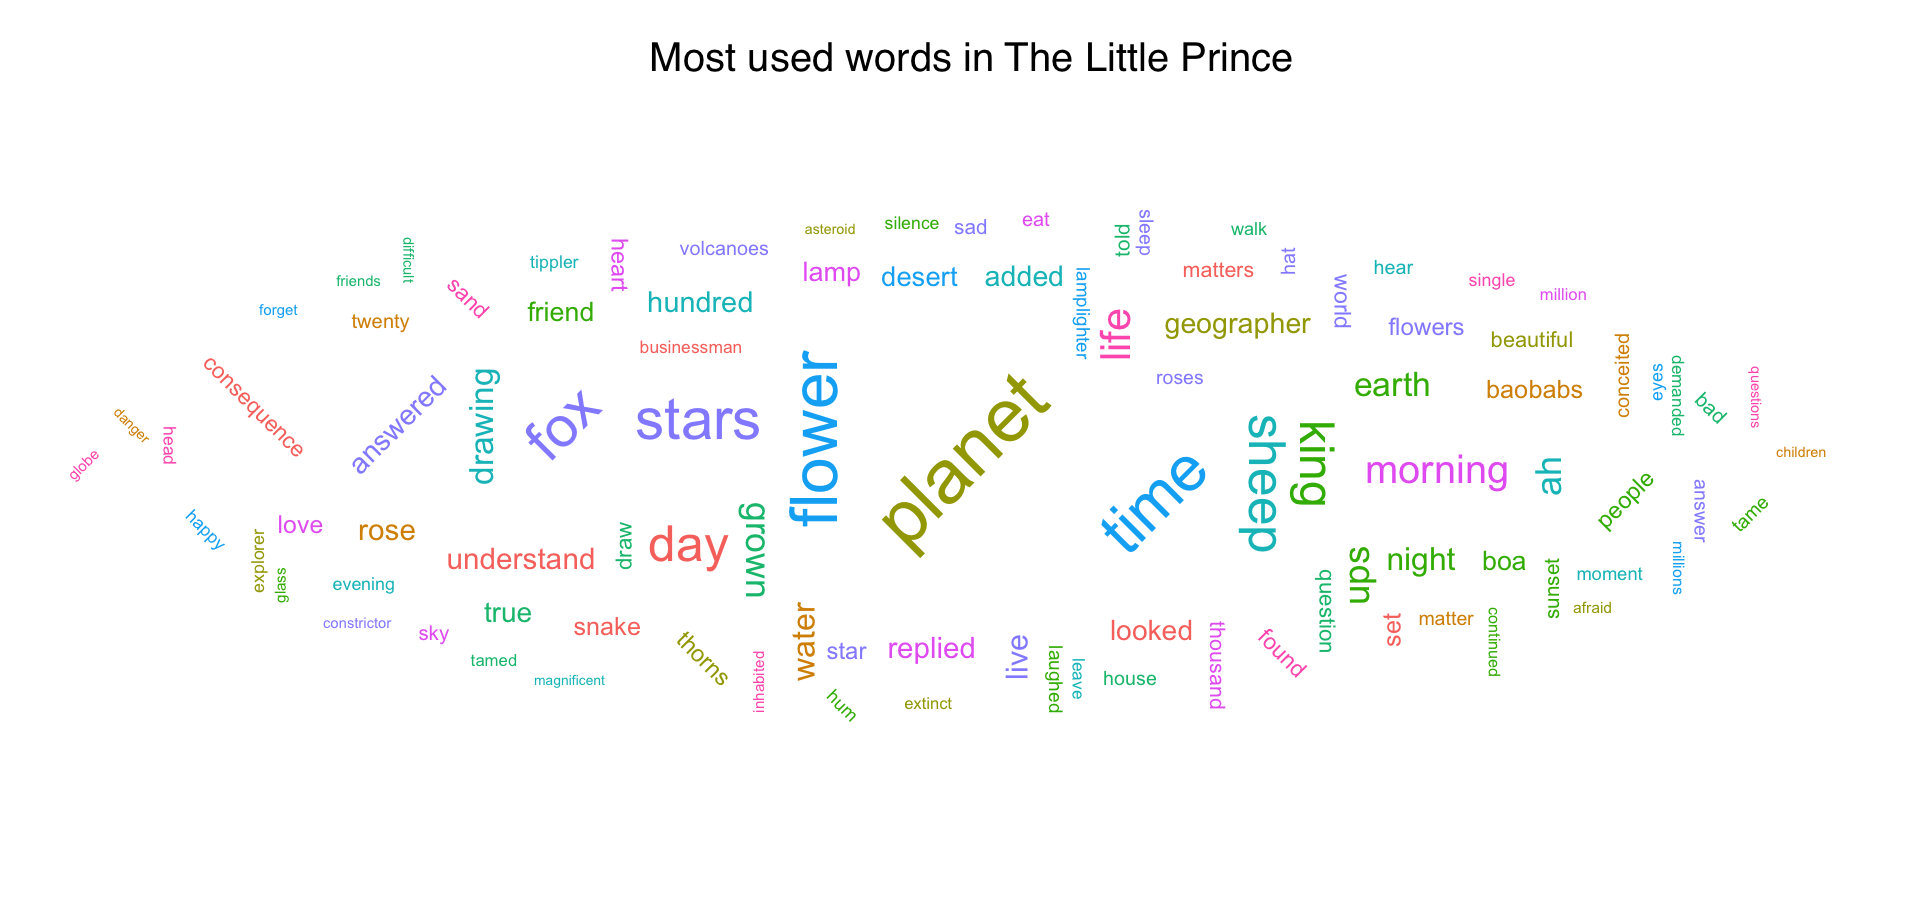
Text and sentiment analysis of 'The Little Prince'
A sentiment analysis of The Little Prince using the NRC lexicon and a nice word cloud with the 100 mos used words in the text.
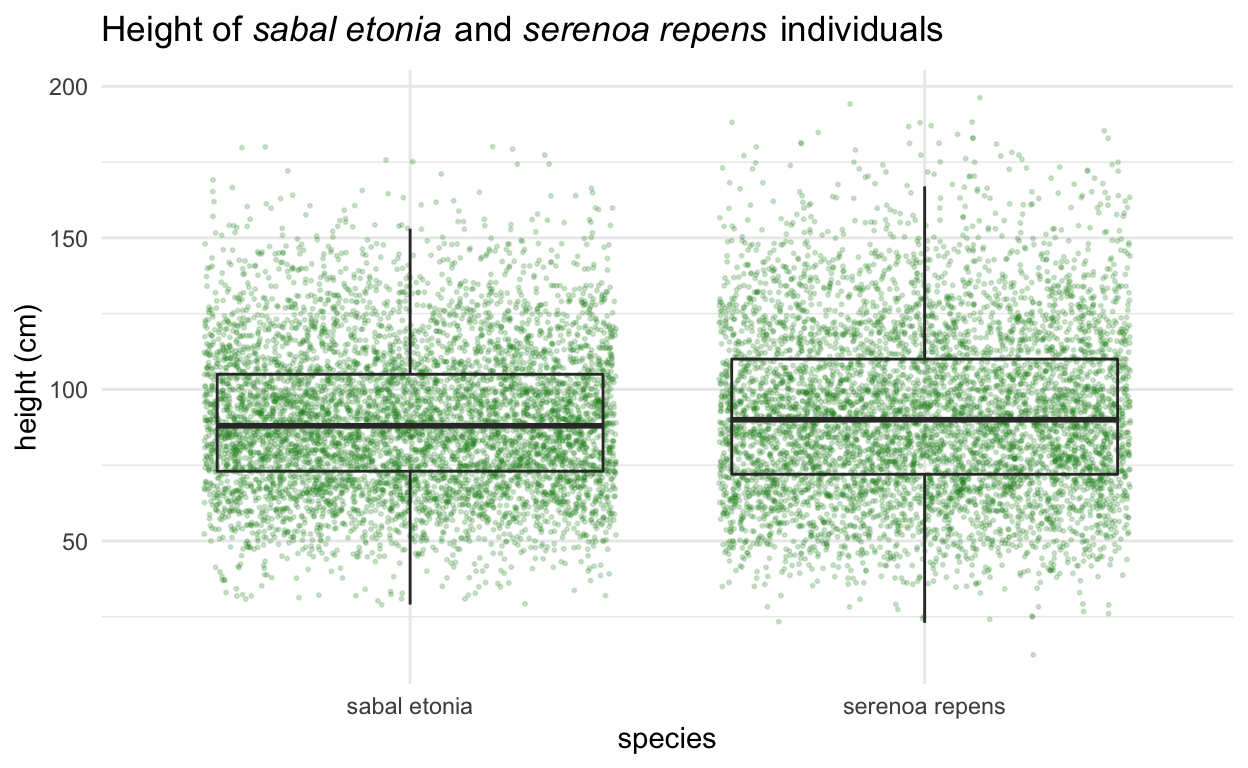
Logistic regression: classifying palm species
Classification of palm species by their morphological characteristics via logistic regression. Simple machnine learning example.
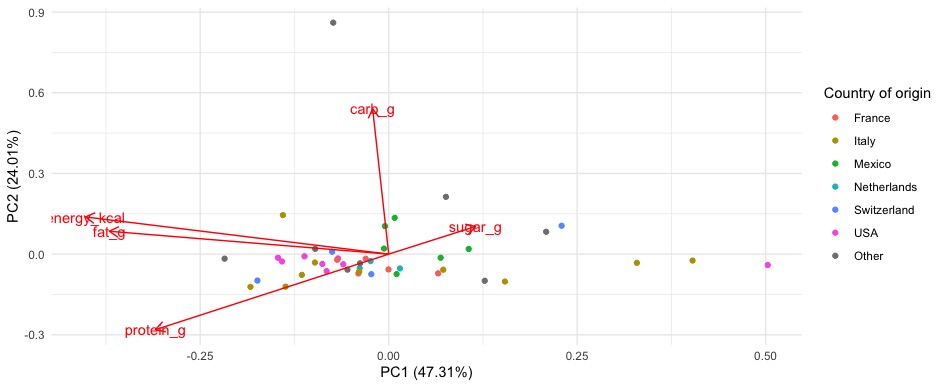
Principal Component Analysis (PCA): exploring similarities among cheeses
How similar are cheeses depending on their country of origin? This project uses principal component analysis (PCA) on the nutrition data for 45 types of cheeses from 10 countries to explore this question.
Chi-square analysis: political affiliation and environmentalist self-identification
Analysis of the relation between answers to survey questions about the respondent's self-identification in the political spectrum and as environmentalists. To perform this analysis we use a chi-square test for independence
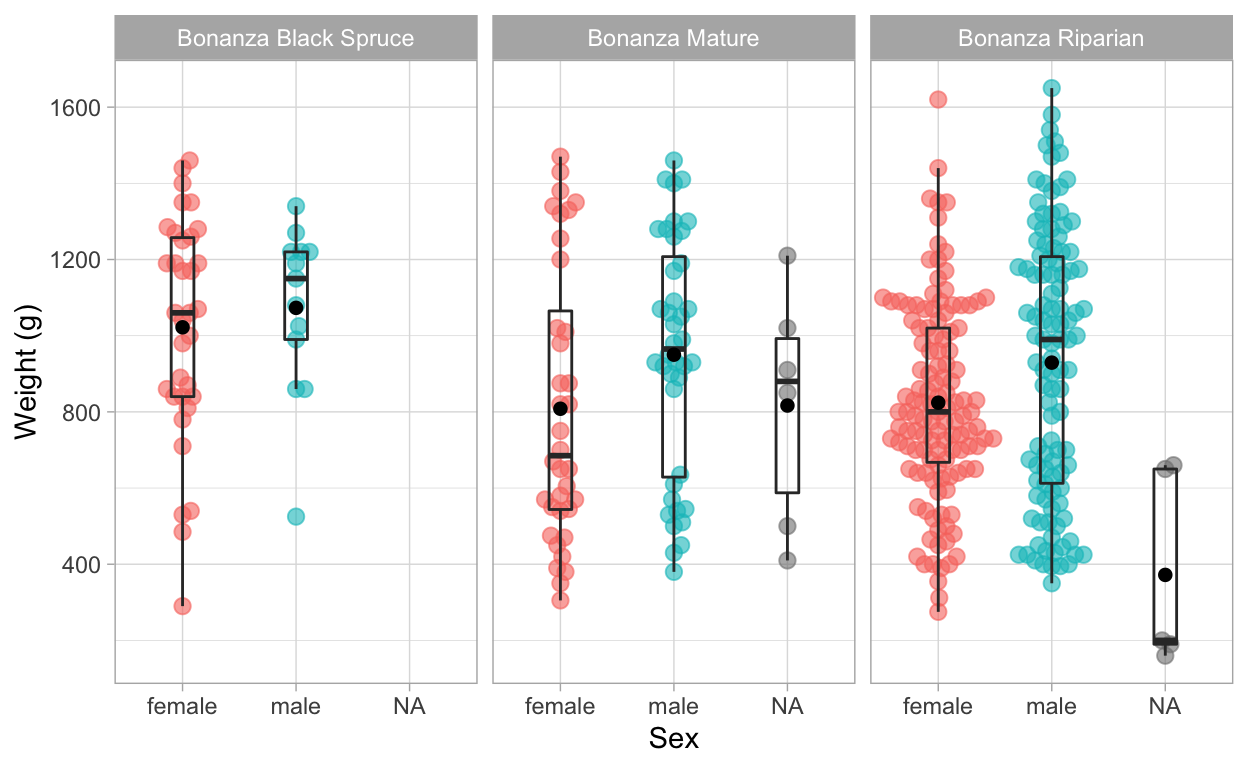
Linear regression model: exploring a snowshoe hare data
Analysis of snowshoe hares' characteristics and numbers at the Bonanza Creek Experimental Forest.